


 38 / 116

3 8
PLUMBING CONNECTION
SUMMER 2016
“The the force and coverage tests came in as an informative
which is different to a normative. It is still an informative, but
due to AS/NZS 6400:2005 and ITS labelling scheme; nothing
has changed from 0-3 stars, but with this extra column:
compliance with spray, force and coverage, you’ve got the
Range E (6-7.5 litres per minute) and Range F (4.5-6 litres per
minute).
“If a manufacturer is producing a nominal flow within
those bands it needs to now look at these two tests. They
are informative but in essence become a mandatory
requirement for the labelling,” Stephen says.
To facilitate the force and coverage requirements, CSIRO
developed an impressive new test rig. A dome featuring a
load cell underneath measures the force aspect.
“We push water through at 150, 250 and 350kPa onto
the dome for this particular standard. We look at the mains
flow at each of those water pressures hitting the dome at a
distance which is pretty much consistent with all the other
distances we use across our performance testing. And then
we measure the average of the water at 150, 250, 350kPa.
“Water is obviously hitting the dome which means it will
move a little bit (grams force).
“The average for the criteria now is looking at greater
than 85 grams force. We are looking at that number as users
require enough water to get soap and suds off the skin and
hair. It is imperative to maintain a short shower (Aus suffers
from droughts) and come out refreshed and clean.
“For very low flowing shower to achieve this,
manufacturers may need to increase velocity by tightening
up on the nozzles or create a wider spread of these flow
nozzles. It might actually mean the manufacturers have to
go back to the drawing board because their standard shower
might not produce that, so that can be a challenge.
The second part of the testing rig looks similar to the old
angular testing gauges but it features some significant
differences.
“We’re collecting water in tubes that sit below the shower
head pattern. Once these tubes are collected over a period
of time, we then measure those tubes and get a pattern. We
analyse where the water falls to observe patterns. It gives
you a visual display whereas the means spray spread angle
only provided an idea of the angle.
“The other factor to consider is the criteria, which has
changed as well. This takes into consideration the volume
and collection within the zones. We have a zone in the middle
and then a zone 1, 2, 3, 4, 5 and 6 which refers to the tubes
and their positioning.
“To ensure we get consistency, we want that spread of
evenness across the spray; we’re looking at the standard
deviation. Users want consistency across the zones on low
flowing showers.”
It is a requirement to have some flow in the middle of
the showerhead for manufacturers to achieve a rating. If a
manufacturer creates a shower head without it, they won’t
bother with this test.
It doesn’t necessarily tell you where the flow is, in the
middle or the outer, it’s not giving you that information.
The fact that this new test tells you exactly where the flow
is coming from is a huge leap when it comes to looking
at a 4 star rated shower. It’s a much better approach to
understanding the patterns and flows. It’s quite a complex
rig and we have spent a long time getting it right; however,
it’s been well worth the effort as the results not only benefit
our clients, but importantly, it will mean users will be able to
make a more informed choice when selecting a shower head
in the future.”
While Stephen believes the new testing rig is a great
accomplishment and that WELS is going in the right
direction, he believes there is some further improvement
needed.
“There are certain areas that need to be looked at from a
more holistic sense which can sometimes be difficult when
using a standard as a ‘one method suits all’. That’s still a
challenge, in my opinion, but I think it can be overcome,
over time. As technologies grow and change, obviously the
willingness of Standards committees to invest more time
and effort will also come into effect.”
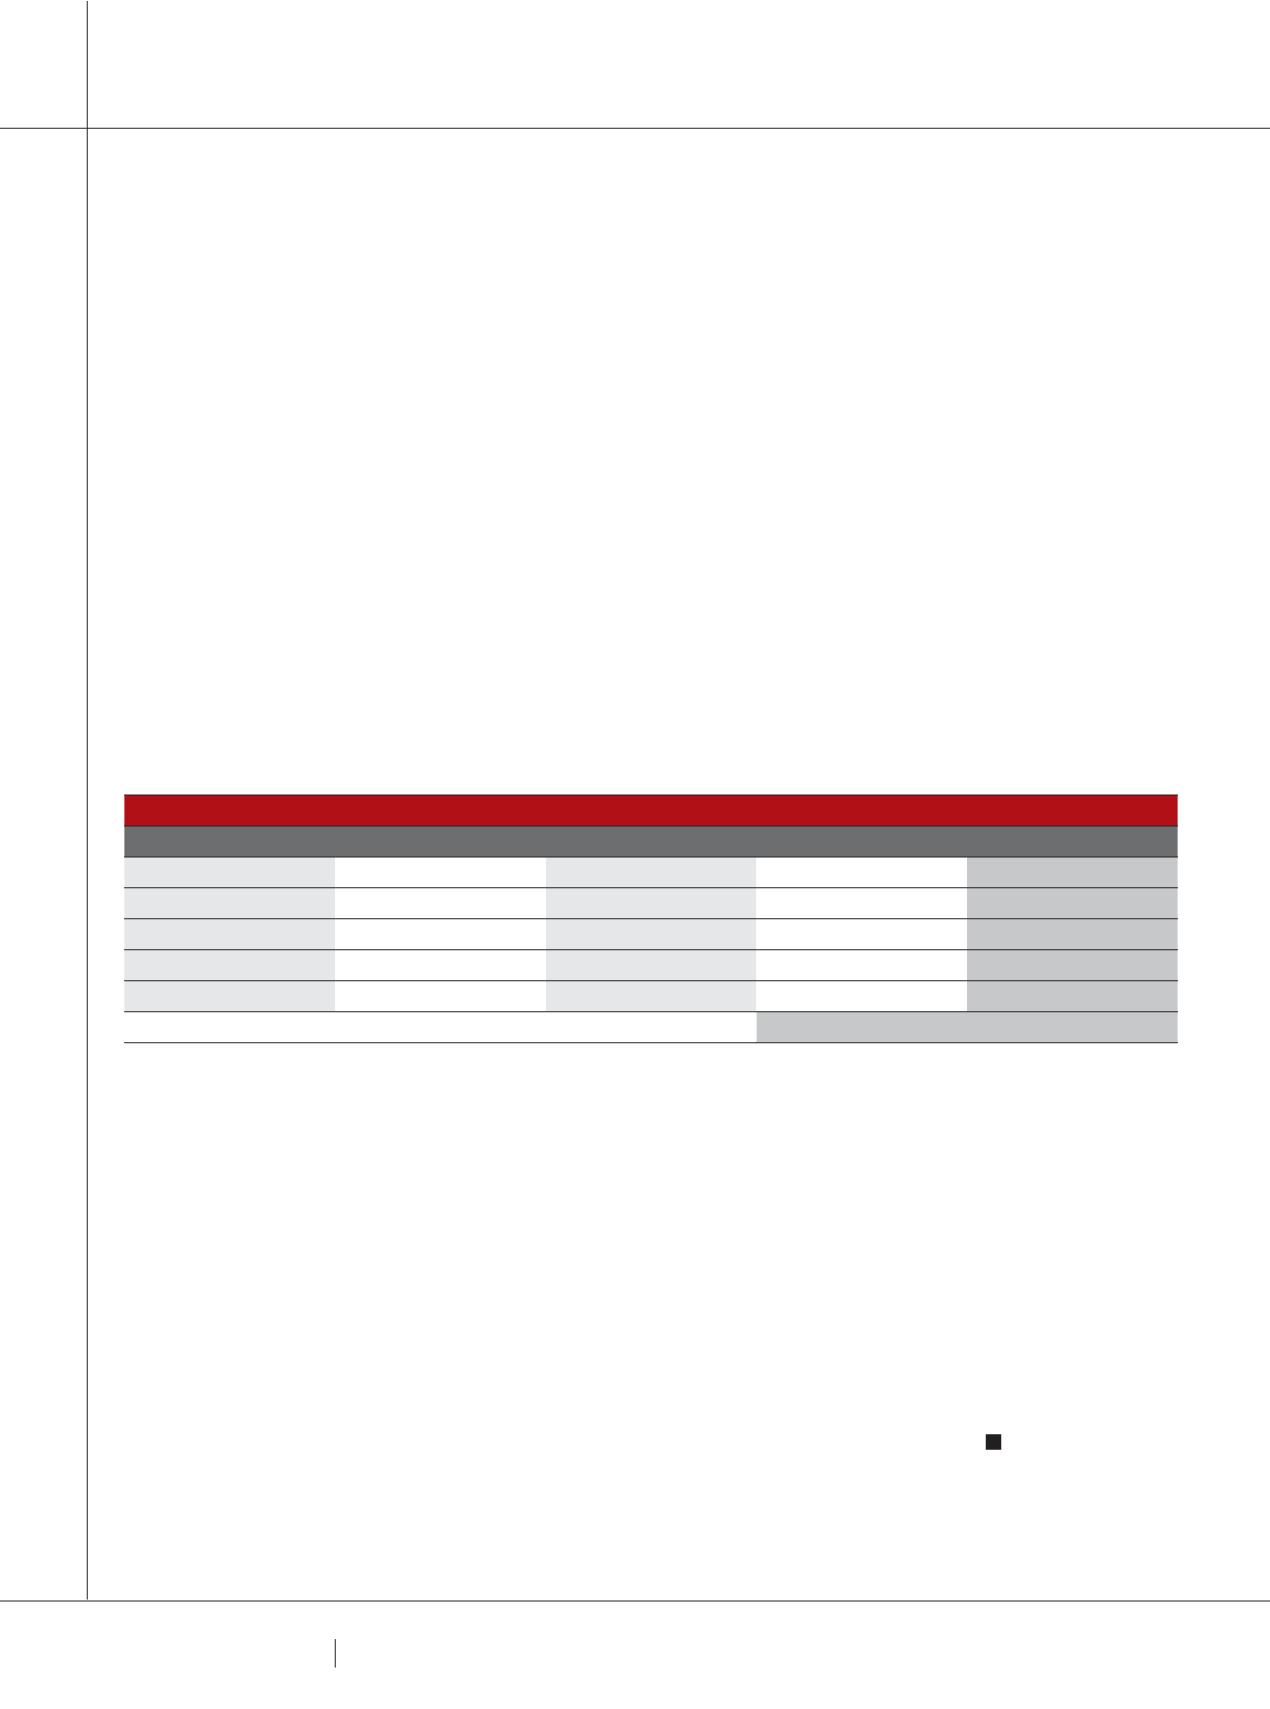
PRESSURE AND FLOWRATES
INCREASING 1
FLOW RATE
INCREASING 2
FLOW RATE
FLOW RATE
Pressure kPa
L/min
Pressure kPa
L/min
Average L/min
150
7.52
150
7.52
7.52
250
8.53
250
8.53
8.53
350
8.58
350
8.58
8.58
500
9.32
500
9.32
9.32
Nominal flow rate (average of 150 to 350 kPa)
8.21
L/min
CSIRO
www.csiro.auWELS
www.waterrating.gov.auWELS