


 12 / 132

12
PLUMBING CONNECTION
WINTER 2015
INDUSTRY NEWS
WORLD DEMAND FOR PLUMBING TO
EXCEED $70 BILLION IN 2018
Through 2018, global demand for
plumbing fixtures and fittings is
projected to advance 5.3% annually
to over $70 billion, accelerating
from the 2008-2013 pace. In lower
income countries, including many in
the Asia/Pacific and Africa/Mideast
regions, continued strong increases
in building construction spending
and rising personal income levels
will support growth. In a number of
West European countries and the
US, expected rebounds in building
construction spending will drive
demand for plumbing products. These
and other trends are presented in
World Plumbing, a new study from The
Freedonia Group, Inc., a Cleveland-
based industry market research firm.
The Asia/Pacific region will
post the fastest overall growth
in plumbing products demand.
According to analyst Allison
Blackburn, “Even with an expected
deceleration in demand, China alone
will account for over one-third of the
increase in global plumbing products
demand generated between 2013
and 2018.”
China’s vast population makes
infrastructure and sewage system
development a necessity, and
therefore new homes are constantly
being connected to water delivery
systems. These systems are
reaching previously unserved areas,
thereby creating new customers and
generating demand for plumbing
products. Other industrializing
countries in Asia, such as India and
Indonesia, and in the Africa/Mideast
region will also contribute to overall
demand gains.
North America is also expected
to post significant gains in demand
for plumbing fixtures and fittings. A
rebound in the US housing market
will be the primary driver of gains.
Accelerating building construction
activity in Canada and recovering
building construction spending
in Mexico will also contribute to
demand growth in North America.
Western Europe is expected to
post the slowest gains in plumbing
products demand through 2018.
The region’s mature building
infrastructure and slow population
growth have combined to limit
building construction activity,
restricting plumbing products
gains. While construction spending
in Western Europe is forecast to
grow at the slowest rate globally, it
will nonetheless reflect a recovery
from a low 2013 base. As a result,
plumbing products demand growth
in the region is forecast to reverse
the declines experienced during the
2008-2013 period.
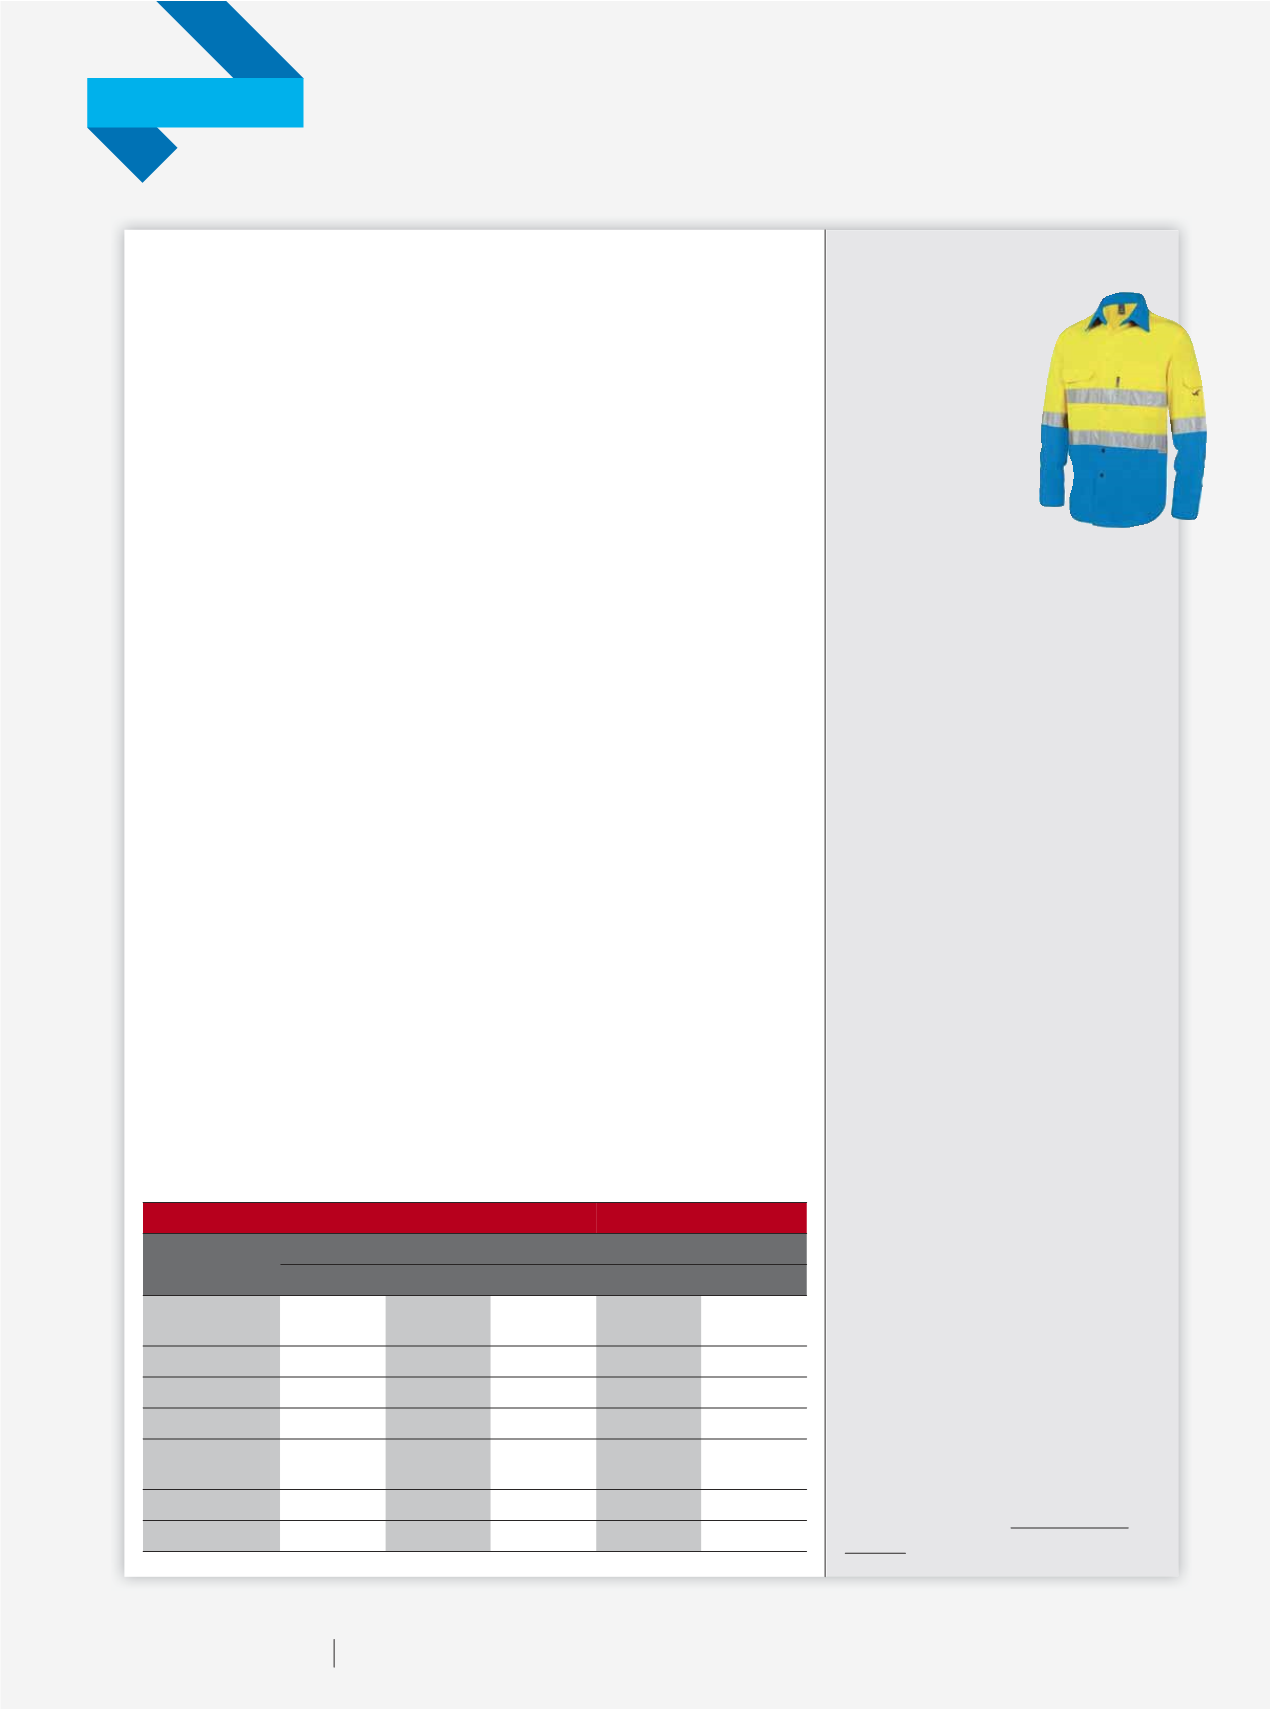
REAL MEN ALSOWEAR BLUE…
The Prostate Cancer
Foundation of Australia
(PCFA) has recently
teamed up with RWW
Group to launch its
Blue Gear range of
safety workwear. A
dollar portion of the
proceeds from the
sale of each Blue
Gear safety workwear item will go
directly towards raising vital funds
and awareness about the dangers of
prostate cancer - the most commonly
diagnosed male cancer in Australia.
The Blue Gear workwear range
includes high-vis shirts, safety vests,
hard hats, polo shirts and various
other items. RWW Group supplies
safety wear for the mining, transport
and construction industries.
“Each day 54 men across Australia
are diagnosed with prostate cancer,”
says Associate Professor Anthony
Lowe, the CEO of the PCFA. “Sadly, it
kills nine men every single day.
“These are devastating statistics
which PCFA is determined to help
change. It is important to raise
awareness of this major men’s health
issue in the Australian community in
male-dominated industries such as
mining, transport and construction.
We hope these industries get behind
the Blue Gear and also use our
Ambassador speakers to educate
their employees and workmates.”
Anthony Firth, General Manager
of RWW Group adds “Aussie men in
male-dominated industries need our
support. Many will have been affected
by prostate cancer personally or know
someone who has. Getting behind
PCFA and the Blue Gear safety range
is a great, practical way to generate
vital funds and help raise awareness
of this male cancer killer.”
All Blue Gear items can be
purchased online at www.bluegear.
com.auWORLD PLUMBING PRODUCTS DEMAND (BILLION DOLLARS)
Item
% Annual Growth
2008
2013
2018 2008-2013 2013-2018
Plumbing
Demand
50.0
54.4
70.5
1.7
5.3
North America
11.0
10.8
14.3
-0.3
5.7
Western Europe
12.6
10.4
12.0
-3.8
3.0
Asia/Pacific
15.8
22.4
30.7
7.2
6.5
Central & South
America
3.4
3.8
4.7
1.9
4.6
Eastern Europe
3.7
3.4
4.1
-1.8
3.7
Africa/Mideast
3.4
3.6
4.7
1.4
5.1